by Lennertz | Mar 20, 2020 | Data Services
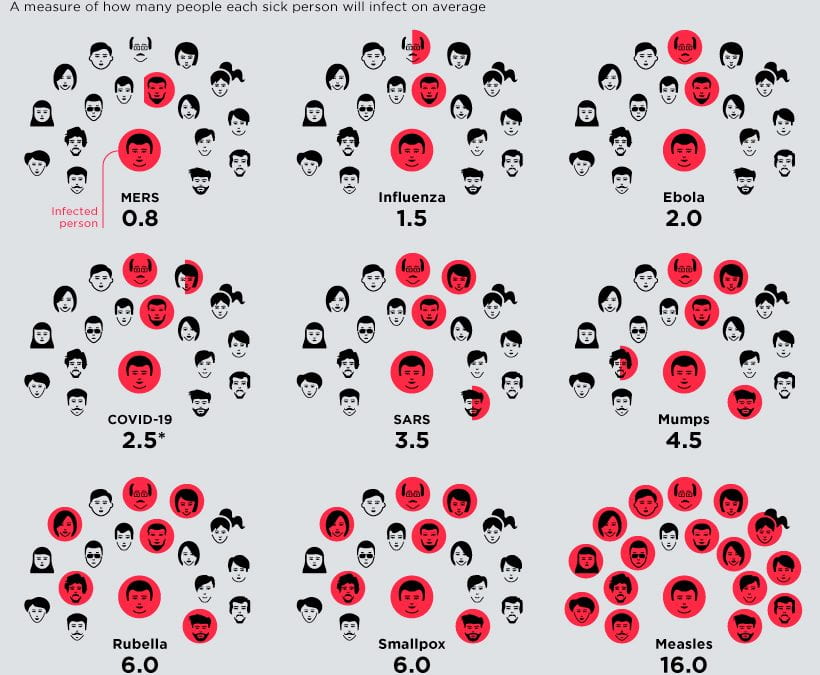
Check out this week’s data visualization. It compares the reproduction rates of six diseases (including COVID-19). Read and see more at Visualizing the History of Pandemics
by Lennertz | Feb 28, 2020 | Data Services
If you are interested in music as data , I suggest that you check out today’s post from Scholarly Kitchen entitled “Every Pop Melody Possible is Now in Public Domain.” The article and the accompanying Ted Talk explores the computational analysis of...
by Lennertz | Feb 19, 2020 | Data Services
In today’s Educause Review, there is a brief feature article in which several librarians were interviewed regarding this year’s top campus IT issues. Read more at...